
Page 158 - IJES Special Issues for AIEC2016
P. 158
58 © Al-Shamani, Mat, Ruslan, Abed, and Sopian 2016 | Effect of New Ellipse Design
thermal PVT power, and the overall PV/T power 1000 Solar Radiation 1200
over daytime were determined. 900 PVT Energy 1100
800 Thermal Energy 1000
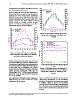
Figure 3 shows the trends of solar radiation, PV, 700 PV Energy
thermal, and PV/T energy for the whole day. PV, 600
thermal, and PV/T energy varied continually 500 900 Solar Radiation, (W/m2)
with increasing solar irradiance and time. The 400
results indicated that the PV, thermal, and PV/T Energy (W) 300 800
energies used for the PV/T collector varied 200
(27.24- 93.70) W, (158.68- 630.67) W, and 100 700
(185.92- 724.37) W, respectively, at a mass flow 09
rate of 0.068 kg/s as shown in Figure 3. 600
500
400
100 Ambient Temperature 1100 300
95 Outlet Temperature 1000 10 11 12 13 14 15 16 17 18
90 PV Temperature 900
85 Solar Radiation Time, (h)
80
Figure 3: Mean power variation of PVT with
Temprature, (C) 75 800 Solar Radiation hourly solar radiation, ̇ = 0.068 kg/s over
70
daytime
65 700
60
55 600
50 100 PV Efficiency
45 500 90 Thermal Efficiency
80 PVT Efficiency
40 400 Reference PV module Efficiency
35
30 300 70
25
20 9 10 11 12 13 14 15 16 17 18200 Efficiencies
Time 60
Figure 2: Hourly solar radiation and hourly 50
mean temperature of (ambient, PVT collector,
40
and water outlet) over daytime
30
Figure 4 illustrates the variation in the reference 20
PV module efficiency and PV/T efficiency (PV,
thermal, and overall) with hourly solar radiation 10
over daytime with the ellipse absorber flow and
a mass flow rate of 0.068kg/s. The results 0 9 10 11 12 13 14 15 16 17 18
showed that the reference PV module efficiency
varied between 7.88-9.52%, while the PV Time
efficiency was 12.55- 13.78%, thermal efficiency
was 57.40- 61.45 %, and overall PVT efficiency Figure 4: Efficiency variation of reference PV
was 71.18- 74.30%. module and PVT (PV, thermal and overall) with
The total of both efficiencies, which is known as hourly solar radiation, ̇ = 0.068 kg/s over
PV/T efficiency, was used to evaluate the overall daytime
performance of the system.
Figure 5 and Figure 6 show the contour profile of
temperature distributions on the PVT-Ellipse
absorber. It is clear that the temperature profile
is uniform. Figure 7 shows the streamline
velocity contour of the PVT-Ellipse absorber, and
it is also clear to see the velocity moving from
inlet to outlet and drop the temperature of PV
module.
Science Target Inc. www.sciencetarget.com