
Page 167 - IJES Special Issues for AIEC2016
P. 167
International Journal of Environment and Sustainability, 2016, 5(2): 61-71 67
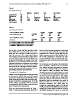
Table 1
Descriptive Statistics
ISO26001/14001 N Minimum Maximum Mean Std. Deviation
EnviDisclosure 246 0 1 .65 .478
RnD 246 0 1 .21 .406
SalesGrowth 246 .00 76826000.00 1143049.6190 6502732.95490
MarketReaction 246 -88.68 13581.87 90.2616 894.78545
Valid N (listwise) 246 20.00 201000.00 13089.9309 32466.37331
246
Table 2
Correlation Test Result
Panel 1: Hypothesis 1 Testing Correlation Reg2004 Reg2007 Reg2012
Environmental Disclosure Sig. .152*** .197*** .192***
.008 .001 .001
Panel 2: Hypothesis 2 Testing Correlation
R & D Cost Sig. Reg2004 Reg2007 Reg2012
.047 .093* .025
.238 .079 .353
***. Correlation is significant at the 0.01 level (1-tailed).
**. Correlation is significant at the 0.05 level (1-tailed).
*. Correlation is significant at the 0.1 level (1-tailed).
For the first, second, and third hypotheses (H1, from food and beverage companies in Indonesia
H2 and H3), the testing is done by using a corre- are increasing significantly and improving after
lation test. The testing of H1 and H2 is used to regulations were issued. It seems that since the
show the presence of a relationship between Indonesian government ratified the Kyoto Proto-
each company when government policy related col in 2004, companies in Indonesia are more
to social and environmental responsibility is im- transparent when it comes to informing the com-
plemented. Meanwhile, the testing of the third munity about their environmental conservation
hypothesis is meant for HED, which is hard envi- activity.
ronmental disclosure, a disclosure on the quality
of the environment on carbon emissions and/or The correlation test result shows that in all years
the success of the company in obtaining interna- when regulations related to the environment
tional certification related to corporate social re- were issued, increased environmental account-
sponsibility (ISO26001 and ISO14001) ancy disclosure followed. When the regulation
was issued in 2004, correlation test results
Testing the First Hypothesis showed the presence of relationships of as much
as 15.2% between the policy and external envi-
Testing of the first hypothesis is done separately ronmental accountancy disclosure. The signifi-
in three periods (2004, 2007, and 2012), which cance we found is 0.008 with an observation
are the years of the issuance of UU RI No.17 Year sample of as many as 246 companies in 11 years.
2004, UU No 40 Year 2007, and Government Reg- Meanwhile, after the regulation was issued in
ulation No.47/2012 (complementary of UU No 2007 and 2012, the area of environmental ac-
40 Year 2007), respectively. The three periods countancy disclosure was wider with the
are predicted to affect the level of corporate obe- strength of relationship as high as 19.7% and
dience related to the environment. 19.2%, and the level of significance of each rela-
tionship is the same, which is 0.001. The result of
From the testing result presented in Panel 1 this finding becomes the reason to accept the
Table 2, environmental information disclosures
Science Target Inc. www.sciencetarget.com