
Page 77 - IJES Special Issues for AIEC2016
P. 77
International Journal of Environment and Sustainability, 2016, 5(1): 64-70 67
slight to moderate degree of restriction with that have high concentrations of suspended
respect to TDS. solids that may cause problems such as clogging
of the irrigation systems, sealing of the soil
Table 1 surface, filling the voids between sand particles,
reducing soil infiltration, and increasing soil
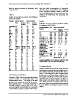
Quality of the Full-scale Septic Tank Effluents compaction.
Used as Feed Water
Parameter Add-on System 1 Add-on System 2 Table 2
Mean Standard Mean Standard Guidelines for Interpretation of Water Quality
Deviation Deviation for Irrigation (WHO, 2006)
Temperature 21.6 1.8 26.1 4.3 Potential Irrigation Unit Degree of Restriction
pH 7.7 0.2 7.7 0.1 Problem
EC 835.9 161 789.2 49.9
TSS 14.3 5 11.1 2.2 None Slight to Severe
TDS 304.9 38 267.6 13.4 Moderate
0.7 44.7 14.8
NO3-N 1.1 15.8 1.7 2 EC μS/m <0.7 0.7 - 3.0 >3.0
16.3 46.1 15.2 TDS mg/l <450 450 - 2000 >2000
NH4-N 56.2 16.8 48.2 14.4 TSS mg/l <50 50 - 100 >100
TKN 57.9 1.3 4.9 1
TN 58 12.4 35.8 8 EC at SAR = 0 - 3 dS/m >0.7 0.7 - 0.2 <0.2
4.6 11.7 2.4 EC at SAR = 3 - 6 dS/m >1.2 1.2 - 0.3 <0.3
PO₄ 5.3 0.4 1.8 0.3 EC at SAR = 6 - 12 dS/m >1.9 1.9 - 0.5 >0.5
COD 37.8 0.3 0 0
BOD5 14.8 3.00E+07 8.9E+6 2.0E+7 EC at SAR = 12 - 20 dS/m >2.9 2.9 - 1.3 <1.3
2.60E+06 1.1E+6 2.6E+6 EC at SAR = 20 - 40 dS/m >5.0 5.0 - 2.9 <2.9
DO 1.4 0.05 0 0 Sodium (Na+): meq/l <3 3 - 9 >9
O&G 0.1 0.03 0.5 0.2
TC 1.40E+07 0.25 0 0 Sprinkler Irrigation
0.3 0.6 0.3 Chloride (Cl−): meq/l <3 >3
FC 1.20E+06 0 0 0 Sprinkler Irrigation
C6H5OH 0.1 0.2 0.3 0.2
F0 0.05 0 0 Chloride (Cl−): meq/l <4 4 - 10 >10
0.2 0 0 Surface Irrigation
H2S 0.3 0.5 0.2 0 Bicarbonate (HCO3) mg/l <90 90 - 500 >500
Al 0.7 0.2 0 0 <0.7 0.7- 3.0 >3.0
As 0 0.1 0.4 0.4 Boron (B) mg/l <5 5 - 30 >30
0 0 0 Total Nitrogen (TN) mg/l Normal range: 6.5 - 8.0
B 0.3 0.1 1 0.8 pH -
Cd 0 0.1 0.7 0.5
Cu 0.1 6.8 13 3.5
Fe 0.3 Electrical conductivity=EC; total dissolved solids=TDS; total
Pb 0.1 suspended solids=TSS; SAR=sodium absorption ratio
Mn 0.1
Hg 0
Ni 0.1 3.4 Organic Matter
Zn 0.1
Mg 15 Organic contents of wastewater usually increase
soil moisture, retain metals, and enhance micro-
3.3 Total Suspended Solids bial activity. Therefore, irrigation with waste-
water is generally better than irrigating with
As given in Table 4, the anaerobic-based treated potable water and then adding synthetic ferti-
system resulted in significantly lower TSS lizers (Ayers and Westcot, 1985). Table 4 shows
concentrations (mean = 7.4 mg/l) in the final that both post-treatment systems resulted in a
product water compared to that of the aerobic- final product that satisfies WHO’s standards. It
based system (mean = 16.4 mg/l). According to also shows that the anaerobic-based system
the WHO (2006), irrigation with such waters was more efficient in removing chemical oxygen
does not require any restriction. It is generally demand (COD) and biological oxygen demand
recommended to avoid irrigation with waters (BOD5).
Science Target Inc. www.sciencetarget.com