
Page 147 - IJES Special Issues for AIEC2016
P. 147
International Journal of Environment and Sustainability, 2016, 5(2): 45-53 47
Table 1 input and output according to localities and in
comparison with Aveiro, Portugal. The follow-
Sources of secondary information ing sections discuss the respective material
flows in Table 2 and Table 3 with supporting
Material Unit Source & Year explanation.
Electricity ktoe Energy Commission (2011)
Water million National Water Services 3.1 Energy Input
litres/day Commission (2011)
Rice, eggs tonnes Food and Agriculture Energy inputs are expressed in kilogram of oil
and sugars Organization of the United equivalent. The highest electricity input was in
billion kg Nations (FAOSTAT) (2014) Kuala Lumpur for the year 2010 with 298 685
Carbon litres/day Ahmad (2004) koe/day. The second highest input of electricity
dioxide kg/cap/day is Selayang with 101 972.89 koe/day, followed
Wastewater Kling (2007) by Ampang Jaya with 88 164.67 koe/day. The
Solid Waste Sakawi (2011) total electricity consumption was 488 822.56
koe/day and agrees with the number of
3. Results and Discussion population in the three cities.
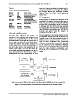
From the data collection and analysis, an The consumption of electricity depends on the
overview of the material flow resources and development and population in the cities. Kuala
output was established (Figure 3). The overall Lumpur is one of the most urbanised states in
material balance reveals that the system is in a Malaysia, hence, massive economic activities as
near steady state where the total input almost well as other residential and commercial
equals total output. This section presents the activities are undertaken to meet the demands
results and discussion of the material flows in of the country and its inhabitants. Although
the three cities with a total population of 2.6 Selayang is less developed compared to Ampang
million people. Table 2 presents the outline for Jaya, the high electrical consumption was
the average individual consumption for all the mostly because of individual use in the popu-
input and output for the three localities. Table 3 lation.
demonstrates the total consumption of each
Note: 1 tonne is equal to 1,000 kg, 1 liter is equal to 1 kg, 1 ktoe is equal to 1,000,000 koe and 1 koe is equal to 1 kg.
Figure 3: Schematic outline of Material Flow Analysis for Greater Kuala Lumpur
Science Target Inc. www.sciencetarget.com