
Page 148 - IJES Special Issues for AIEC2016
P. 148
48 © Shafie, Omar, Karuppannan, and Ismail 2016 | Urban-Scale Material Flow Analysis
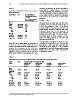
Table 2 sumption of electricity in Aveiro according to
Lemos (2011) is higher, which is 0.347 koe/
Input Output outline for Kuala Lumpur, Ampang cap/day. Meanwhile, the individual consump-
Jaya and Selayang tion in Klang Valley is 0.188 koe/cap/day. Avei-
ro has winter months in which the population
Input / Output Unit Average Individual may consume more electricity to warm their
Consumption/Productio habitation.
n in a Day
Kuala Lumpur, Ampang 3.2 Water Input
Jaya and Selangor
The total inputs of water was 613 773 926.7
INPUT koe/cap/day 0.19 m3/day for the year 2010 in Kuala Lumpur is
Energy kg/cap/day 236.06 375 033 970 m3/day (61.1%), 110 701 057.82
Water kg/cap/day 0.38 m3/day (18%) in Ampang Jaya and 128 038
Foods 0.24 898.90 m3/day (20.9%) in Selayang. The major
0.06 differences were due to the variations in
Rice 0.08 population density. A high population will lead
Eggs to higher demand of water consumption inputs.
Sugar The water input in Kuala Lumpur was the
highest (61.1%) compared to the other two
OUTPUT kg/cap/day 0.46 cities combined (38.9%).
Gas (CO2) kg/cap/day 225
Wastewater kg/cap/day 4.5 The individual consumption in Aveiro in a day
Solid Waste according to Lemos (2011) is 112.60 kg/cap/
day, which is lower than the individual con-
When the total consumption of electricity of sumption in Klang Valley in a day (236.056
each city in a day is compared with the city of kg/cap/day). It is seen that individuals in Klang
Aveiro in Portugal where this methodology was Valley tend to use more water compared to
adopted, the consumption of the three cities individuals in Aveiro.
was higher. One of the reasons is due to the high
population density. However, when compared
with crude individual consumption, the con-
Table 3
Schematic comparison between Kuala Lumpur, Ampang Jaya, Selayang and Aveiro
Input / Unit Total Consumption / Production in a Day Selayang Aveiro Portugal
Output Ampang Jaya Kuala Lumpur Population:
Population: Population: Population: 73 335
468 961 1 588 750 542 409
INPUT koe/day 88 164 298 685 101 972 25 447
Energy m3/day 110 701 057 375 033 970 128 038 898 8 257 521
(Electricity) kg/day 178 205 603 725 206 115 38 134
Water 112 550 381 300 130 178 30 067
Foods 28 137 95 325 32 544 1 467
37 516 127 100 43 392 6 600
Rice
Eggs
Sugar
OUTPUT kg/day 213 377 722 881 246 796 233 205
Gas (CO2) m3/day 105 516 225 357 468 750 122 042 025 6 995 426
Wastewater kg/day 2 110 324 7 149 375 1 440 840 113 669
Solid Waste
Science Target Inc. www.sciencetarget.com