
Page 114 - IJES Special Issues for AIEC2016
P. 114
14 © Mortula, Ahmad, and Shah 2016 | Assessment of Mixing Potential
Assessment of Mixing Potential The experiment was conducted using a mixture
of sewage sludge (30%), green waste (50%) and
Mixing potential was investigated mathemati- food waste (20%). The setup was operational
cally based on mixing sewage sludge, green for six weeks. Samples were collected using
waste and food waste. Different proportions of standard procedures and tested for compost
mixing of these wastes were investigated. The quality.
target was set to achieve optimal moisture
content and a C/N ratio of 20-25:1. Considera- 3. Results and Discussion
tions were also made on the amount of solid
waste generated within the municipality of Composting Potential for Organic Waste Mix-
Sharjah. ture
Experimental Approach Waste characterization analysis showed that
sewage sludge had very high moisture content,
One of the potential mixing proportions a low salinity and low C/N ratio (Table 2). On
identified in the previous section was used in the other hand, green waste had very low
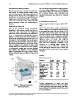
the bench scale experiment. The Naturemill moisture content, a high salinity and high C/N
setup was used for the bench scale experiment. ratio. Food waste had a moderate moisture
It is a decentralized composting machine content, moderate salinity and low C/N ratio.
(Figure 1). They aerate the waste mixture to Different types of waste had different
optimize the composting process. There are two characteristics. Green waste often had a very
chambers in the Naturemill. The top lid opens high void ratio, indicating suitability to be
directly to the first chamber where the food is operated as a bulking agent during the
discarded, and the flappers at the bottom of this composting process. Therefore, appropriate
tray or chamber are slanted so that small mixing among the different types of waste has
enough pieces are produced once the compost good potential for production of good quality
is decomposed enough and can pass through compost.
the flappers. The flappers can be dislodged
using a mechanical lever. The model is fitted Table 2
with an activated carbon air filter to remove any
odours.
Waste Characteristics
Parameter Sewage Green Food
pH Sludge Waste Waste
Conductivity, ms/cm 7.1 6.05 4.33
Salinity, % 0.779 11.38 5.28
Moisture Content, % 0.4 6.5 2.8
Organic matter at 80.82 7.9 58.91
550 C, % 72.14 70.8 93.72
Organic Carbon, %
C:N Ratio 41.84 41.06 54.35
Total Nitrogen, % 7.48 36.99 15.71
Phosphorus as 5.56 1.11 3.46
P2O5, % 2.59 0.34 0.71
Figure 1: Naturemill schematic Several combinations of waste mix were
(Naturemill 2015) analysed (Table 3). Based on the mass analysis
of the appropriate mix proportions, C/N ratios
were estimated. It indicated the C/N ratio of 20-
25 can be achieved.
Science Target Inc. www.sciencetarget.com