
Page 115 - IJES Special Issues for AIEC2016
P. 115
International Journal of Environment and Sustainability, 2016, 5(2): 12-17 15
Table 3 observed C/N ratio was expected to be 23.9:1.
The experimental results revealed the C/N ratio
Mix proportion to C/N ratio of 25. Even though the number was higher than
that accepted by the ministry, it is close to the
Mix Sewage Green Food Mix C/N values expected during the mixing. Therefore,
No. Sludge (%) Waste (%) Waste (%) Ratio having a higher portion of sewage sludge might
40 22.6 reduce the salinity level and decrease the C/N
1 20 40 30 21.8 ratio.
2 30 40 20 20.9
3 40 40 30 24.7 Table 5 Mix Ministry
4 20 50 20 23.9 Compost Quality Quality Requirement
5 30 50 10 23.1 Parameter 5.49 ≤ 7.5
6 40 50 35 23.7 9.7 ≤ 10
7 20 45 25 22.8 pH 5.4 < 2%
8 30 45 15 22.0 Conductivity, ms/cm 9.9 < 25%
9 40 45 Salinity, % 84.19 ≥ 40%
Moisture Content, % 48.83 Around 54%
Moisture contents for different combinations of Organic matter at 550 C, % 25.04 ≤ 20:1
mix proportions were also analysed (Table 4). Organic Carbon, % 1.95 From less than 1%
The majority of the combinations had a C:N Ratio to 5%
moisture content of 40%-50%. Typically a Total Nitrogen, % 0.6 NA
moisture content of 40%-60% is preferred as Phosphorus as P2O5, %
part of compost quality. Therefore, it is an
indication that the mix proportions can produce
acceptable moisture levels as well.
Table 4
Mix proportion to moisture content 4. Conclusions and Recommendations
Mix Sewage Green Food Mix Moisture Conclusions
No. Sludge (%) Waste Waste Content (%) The study investigated the potential for mixing
(%) 42.9 sewage sludge, green waste and food waste.
(%) 40 45.1 Mathematical analysis based on the characteristics
30 47.3 of the individual waste collected from Sharjah
1 20 40 20 37.8 Municipality was investigated. Laboratory-based
2 30 40 30 40.0 analysis was conducted on the viability of mixing
3 40 40 20 42.2 the three different types of organic waste for
4 20 50 10 40.3 generation of a suitable compost.
5 30 50 35 42.5
6 40 50 25 44.7 The results indicated three different types of
7 20 45 15 waste had three different types of
8 30 45 characteristics required for suitable compost.
9 40 45 Therefore, a suitable mixing can provide the
basis for creating good quality compost.
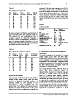
Experimental Results Experimental results also indicated that co-
composting by mixing different types of waste
Experimental results of Mix No. 5 indicated that in appropriate proportions can provide good
mixing sewage sludge, green waste and food quality compost for the municipality of Sharjah.
waste can produce acceptable qualities of
compost (Table 5). The majority of the The study revealed that the co-composting of
characteristics were acceptable by the sewage sludge, green waste and food waste in
government. The salinity level observed was appropriate proportions produced a good
high due to high salinity levels in the green
waste. Based on the mathematical analysis, the
Science Target Inc. www.sciencetarget.com