
Page 176 - IJES Special Issues for AIEC2016
P. 176
76 © Shareef, Husain, and Alharbi 2016 | Optimal Air Quality Monitoring Network
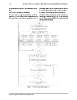
are illustrated in Figure 1 and elaborated as fol- particular station or set of stations can be chosen
lows. or a set of all possible stations tested in a loop.
2.3.1 Step 1: Selection of Stations 2.3.2 Step 2: Storing the Observed Values
As a first step, a single station (P) or set of sta- The observed concentrations at the selected sta-
tions (P1, P2...) are selected to be eliminated from tion (P()) or stations (P1(), P2() …) are stored as
the vector dataset used for creating the raster. A arrays. These values will later be compared with
the interpolated values.
Figure 1: Station elimination process
Science Target Inc. www.sciencetarget.com