
Page 177 - IJES Special Issues for AIEC2016
P. 177
International Journal of Environment and Sustainability, 2016, 5(2): 72-88 77
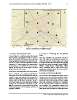
Figure 2: Distribution of AQMN in Riyadh
2.3.3 Step 3: Creating Vector Layer 2.3.5 Step 5: Extracting the Interpolated
Value
A vector layer is a coordinate-based data model
that represents geographic features, such as This step calculates the predicted concentra-
points. Each point is the station represented by tions. The values at the eliminated stations are
the geographical coordinates. The layer has a col- extracted from the created rasters. The values
umn of “z” values used for interpolation. Several for each interpolation method (IDW, SPL, OK, UK,
columns of “z” values, such as the concentration and NN) are stored in separate arrays (IDW1(),
of the pollutants, are added to the vector for sim- IDW2()…; SPL1(), SPL2()…; OK1(), OK2()…; UK1(),
ulation. In this step, the vector layer is created UK2()… and NN1(), NN2()… ). This process of in-
without the selected stations. terpolation and value extraction is repeated for
all the observed datasets.
2.3.4 Step 4: Creating Raster from the Vector
2.3.6 Step 6: Performance Measure
Raster is defined as a spatial data model that de-
fines space as an array of equally sized cells ar- The process of interpolation and value extrac-
ranged in rows and columns and composed of tion generates arrays of the interpolated values.
single or multiple bands. Each cell contains an at- In this step, the performance measures are ap-
tribute value and location coordinates. Rasters plied to observed and interpolated values. RMSE,
are created using the vector data and by applying Bias, and correlation coefficient are calculated
appropriate interpolation techniques. In this for the selected stations and the five interpola-
step, five rasters are created using IDW, Spline, tion methods. The interpolation method that
Ordinary Kriging, Universal Kriging and Natural generates the minimum performance measure is
neighbor methods. then chosen and the others are discarded. These
Science Target Inc. www.sciencetarget.com