
Page 179 - IJES Special Issues for AIEC2016
P. 179
International Journal of Environment and Sustainability, 2016, 5(2): 72-88 79
Table 2 ACFT
0.960
Performance measures for O3 simulations 0.973
1.003
No. of Optimal station(s) Interpol. RMSE r2 MAPE NSE 1.099
station(s) to be combination that can be method 3.224 0.953 1.095
eliminated eliminated IDW 3.811 0.925 4.041 0.944 1.015
1 11 IDW 3.964 0.913 5.153 0.919 1.081
2 11, 15 UK 4.588 0.911 7.991 0.901 1.138
3 4, 11, 15 UK 5.495 0.862 15.699 0.884
4 4, 11, 12, 15 IDW 6.113 0.831 22.805 0.844
5 4, 5, 11, 15, 16 UK 6.488 0.832 25.322 0.821
6 4, 8, 11, 12, 13, 15 IDW 7.018 0.817 36.469 0.809
7 4, 5, 8, 11, 12, 15, 16 IDW 49.610 0.775
8 4, 5, 6, 8, 11, 12, 15, 16
RMSE
16
14
12
RMSE 10
O3
8
Nox
6 SO2
CO
4
2
0
0123456789
Number of stations
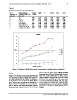
Figure 3: Variation of RMSE with respect to combination of stations that are eliminated
3.1 O3 16 were the best eight stations. RMSE and MAPE
increased from 3.224 to 7.018 and 4.041 to 49.61
Table 2 presents the results of the simulation for from one station elimination to eight, respec-
O3. The values of RMSE, r2, MAPE, NSE and ACFT tively. Similarly, NSE and ACFT decreased from
are shown along with the number of stations to 0.944 to 0.775 and 0.960 to 1.138, respectively.
be eliminated. The variations of RMSE, MAPE In order to limit MAPE within 25%, the maxi-
and r2 with respect to stations are illustrated in mum number of stations that could be elimi-
Figure 3, Figure 4 and Figure 5, respectively. Sta- nated was six (4, 8, 11, 12, 13 and 15). This also
tion 11 was the best single station that could be generated a satisfactory RMSE (6.113) and r2
eliminated, and stations 4, 5, 6, 8, 11, 12, 15 and (0.831).
Science Target Inc. www.sciencetarget.com