
Page 180 - IJES Special Issues for AIEC2016
P. 180
MAPE80 © Shareef, Husain, and Alharbi 2016 | Optimal Air Quality Monitoring Network
r2 MAPE
80
70
60
50
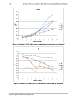
O3
40
Nox
30 SO2
CO
20
10
0
0123456789
Number of stations
Figure 4: Variation of MAPE with respect to combination of stations that are eliminated
r2
1.1
1
0.9
0.8
0.7
0.6 O3
0.5 Nox
SO2
0.4
CO
0.3
0.2
0.1
0
0123456789
Number of stations
Figure 5: Variation of r2 with respect to combination of stations that are eliminated
Science Target Inc. www.sciencetarget.com