
Page 183 - IJES Special Issues for AIEC2016
P. 183
International Journal of Environment and Sustainability, 2016, 5(2): 72-88 83
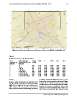
Figure 8: Stations required to generate SO2 concentration maps (RMSE<5 and MAPE<25)
Table 5
Performance measures for CO simulations
No. of Optimal station(s) Interpol. RMSE r2 MAPE NSE ACFT
station(s) to be combination that can be method 0.144 0.877 0.914
eliminated eliminated IDW 0.174 0.838 6.608 0.841 0.901
1 10 UK 0.237 0.807 6.842 0.775 0.863
2 10, 16 UK 0.239 0.718 11.283 0.671 0.915
3 2, 10, 16 UK 0.236 0.665 16.928 0.659 0.953
4 2, 10, 14, 16 IDW 0.287 0.581 25.182 0.647 0.870
5 2, 9, 10, 14, 16 IDW 0.288 0.509 34.782 0.476 0.951
6 2, 4, 9, 10, 14, 16 IDW 0.329 0.444 44.646 0.467 0.926
7 2, 4, 7, 9, 10, 14, 16 UK 51.856 0.374
8 2, 4, 7, 9, 10, 14, 15, 16
3.3 SO2 in Table 4. To limit the MAPE value to <25, a max-
imum of five stations could be eliminated. Figure
Station 1, which is located in the outskirts of the 8 shows the rest of the 11 stations required to
city, was the best station to be eliminated with produce the SO2 concentration maps. The higher
RMSE=2.155, MAPE=2.155 and r2=0.944. For number of stations is needed for this, as the
eight stations, these parameters increased to sources of SO2 are distributed with a wide varia-
9.962, 69.931 and 0.301, respectively, as shown tion in the concentration. The stations in the
Science Target Inc. www.sciencetarget.com