
Page 184 - IJES Special Issues for AIEC2016
P. 184
84 © Shareef, Husain, and Alharbi 2016 | Optimal Air Quality Monitoring Network
south—2, 3, 7, 8—are predominantly located in MAPE values ranged from 6.608 to 51.586 for
the industrial area where power plants and re- one station to eight station elimination as shown
fineries are located. Other stations are in the res- in Figure 4. Station 10 was the best single station
idential area where exhaust from automobiles that could be eliminated and the stations 2, 4, 7,
could be the source of SO2. Station 9 is in the ag- 9, 10, 14, 15 and 16 were the best eight stations.
riculture area and 14 and 16 are located in the However, in order for the MAPE to be within 25,
automobile workshops and small scale indus- a maximum of only five stations could be elimi-
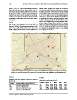
tries zones. nated as shown in Table 5. The NSE, ACFT and r2
values were satisfactory for this 5-station elimi-
3.4 CO nation. Figure 9 shows the rest of the 12 stations
that are needed to make good CO concentration
The results of simulations run on CO data are maps. As shown in the figure, most of the stations
shown in Table 5. Since the concentrations of CO are located in industrial zones or the highly
were very small, RMSE values were also very densely populated areas.
small, ranging from 0.144 to 0.329 (Figure 3).
Figure 9: Stations required to generate CO concentration maps (RMSE<0.24 and MAPE<25)
Table 6 Table 7
Pollutant and the stations needed to achieve Parameters with priority as O3
MAPE <25
Pollutant RMSE r2 MAPE NSE ACFT
Pollutant Stations needed to achieve MAPE <25 O3 6.114 0.821 1.016
O3 1, 2, 3, 5, 6, 7, 9, 10, 14, 16 NOx 24.173 0.831 25.322 0.189 1.122
NOx 1, 2, 4, 8, 9, 10, 12, 13, 15 CO 0.490 0.208 57.374 0.221 1.112
SO2 2, 3, 5, 7, 8, 9, 10, 11, 12, 14, 16 SO2 17.579 0.234 82.670 -4.570 2.302
CO 1, 3, 4, 5, 6, 7, 8, 11, 12, 13, 15 0.056 240.894
Science Target Inc. www.sciencetarget.com