
Page 182 - IJES Special Issues for AIEC2016
P. 182
82 © Shareef, Husain, and Alharbi 2016 | Optimal Air Quality Monitoring Network
and r2=0.864. These values increased to 14.684, emissions, the primary source of NOx is from au-
27.468 and 0.312, respectively, for eight station tomobile emissions, which are reasonably
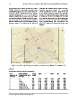
eliminations (Figures 3, 4 and 5). For MAPE sce- evenly distributed over the study area, and
nario of <=25, 7, a maximum of seven stations hence a fewer number of stations is required to
could be eliminated (3, 5, 6, 7, 11, 14 and 16). produce the concentration maps. Stations 4 and
However, RMSE and r2 values were not within 8 signify the presence of industries, and the
the predefined limits. Taking the MAPE as prior- other stations are spread over the densely popu-
ity, a minimum of nine stations were needed to lated areas in the city where the automobiles
produce satisfactory NOx concentration maps as move predominantly. The ACFT=0.966 and
shown in Figure 7. In addition to the industrial NSE=0.341 supports the elimination of the seven
stations.
Figure 7: Stations required to generate NOx concentration maps (RMSE<15 and MAPE<25)
Table 4
Performance measures for SO2 simulations
No. of Optimal station(s) Interpol. RMSE r2 MAPE NSE ACFT
station(s) to be combination that can be method 2.155 0.323
eliminated eliminated UK 3.991 0.446 2.155 -1.507 0.983
1 1 IDW 4.599 0.375 5.925 0.421 1.029
2 1, 4 UK 4.737 0.268 10.792 0.355 1.042
3 1, 4, 13 IDW 5.124 0.582 15.562 0.167 1.063
4 1, 4, 6, 13 IDW 6.258 0.642 25.187 0.428 1.140
5 1, 4, 6, 13, 15 IDW 7.579 0.469 43.558 0.284 1.248
6 1, 4, 6, 11, 13, 15 UK 9.962 0.301 60.337 0.038 1.278
7 1, 4, 6, 7, 11, 13, 15 UK 69.931 0.100 1.279
8 1, 4, 6, 7, 9, 11, 13, 15
Science Target Inc. www.sciencetarget.com