
Page 70 - IJES Special Issues for AIEC2016
P. 70
60 © Kaur, Gupta, and Syal 2016 | Development and Validation of ICT
appliances in a building. Another section considerable section (40%) knew the correct
(23.3%) comprehended energy auditing to be meaning of sustainable development.
purchasing energy-efficient appliances. Some
respondents expressed they had never heard The total score attainable in each category and
the term. the mean knowledge score attained by sample
in each category was evaluated. The average
Knowledge Regarding Electricity Bill percentage is seen to very low in the categories
energy scenario and initiatives (17.29%),
It was seen that only 26.2% correct responses electricity bill (13.20%) and mitigation and
were obtained for unit of electricity. adaptation (12.43%). This indicates that
Respondents were not very aware of the knowledge in these categories was very low.
electricity rates in the city. Nearly one third Also, in all other categories, average score
(35%) of the respondents identified Rs. 2.7. percentage is seen to be lower than 40%. The
However, only a small section (13%) could total average parentage is computed to 26.34%.
ascertain the correct minimum price of
electricity in Delhi. Similarly, for maximum rate, The youth’s knowledge regarding energy man-
only 22% could ascertain the correct answer in agement is tested using a knowledge-testing
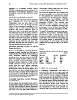
the test. In the pretest, only 14% knew about questionnaire. Table 1 indicates that in the
sanctioned load. The participants expressed pretest, the largest category (48.72%) of the
they had not heard this term earlier. An attempt respondents scored low on the knowledge test,
was also made to ascertain the knowledge and another section of respondents (11.9%)
regarding current electricity slab rates. This scored average. A small section scored high
parameter obtained very low responses; only (4.89%) and very high (1.91%) on the knowl-
8% could identify the correct slab rate. edge test.
Knowledge Regarding Concept of Climate Table 1
Change and Causes
Distribution of the sample indicating the knowl-
It was seen that 35% of respondents knew the
meaning of global warming, and 30% had an edge scores N=470
understanding of the concept of the greenhouse
effect. Responses obtained for identifying Test Scores Pre- Test Pre Test (%)
greenhouse gases was also seen to be low (4%- 229 48.72
28%). The largest category (60%) of respon- Very low 0-20 153 32.55
dents answered that transportation led to Low 21-40 56 11.91
maximum carbon emissions. A small section Average 41-60 23 4.89
(8.3%) considered energy supply to be the High 61-80 9 1.91
sector with the most carbon emissions. Very high 81 and above
Respondents were also asked to list some
anthropogenic causes of climate change. Very 4.3 Skill Level of Participants
few responses were obtained with deforestation
being the largest category (22%) followed by A skill-testing questionnaire was used to
use of private transport (17%). A small section understand the skills of the sample regarding
(11%) expressed increased use of gadgets and energy management. Several skill-building acti-
electronics was also one of the causes. vities, such as energy auditing, calculating
energy consumption and electricity bill, identi-
Knowledge Regarding Concept Mitigation fying BEE labels and calculating energy saved
and Adaptation by installing energy efficient appliances, were
done during intervention. In the pretest, very
In this category, the respondents were asked to few respondents (5.1%) could calculate the
identify climate change’s mitigation agency, and electricity consumption of the room. Only 5 of
only 9% could identify the agency. Knowledge the respondents (1.1%) could calculate the
regarding India’s commitment to reduction was electricity bill. In government schools, none of
also seen to be very low (10%). However, a
Science Target Inc. www.sciencetarget.com